Empower Digital Data
Business Intelligence Dashboards
Unlock the Power of Your Data
At Empower Digital Data, we believe that data is your most valuable asset—when it’s accessible, actionable, and visualized for decision-makers at every level. Our Business Intelligence (BI) Dashboard solutions transform raw numbers into clear, interactive insights that drive smarter, faster, and more profitable business decisions.
What Is a Business Intelligence Dashboard?
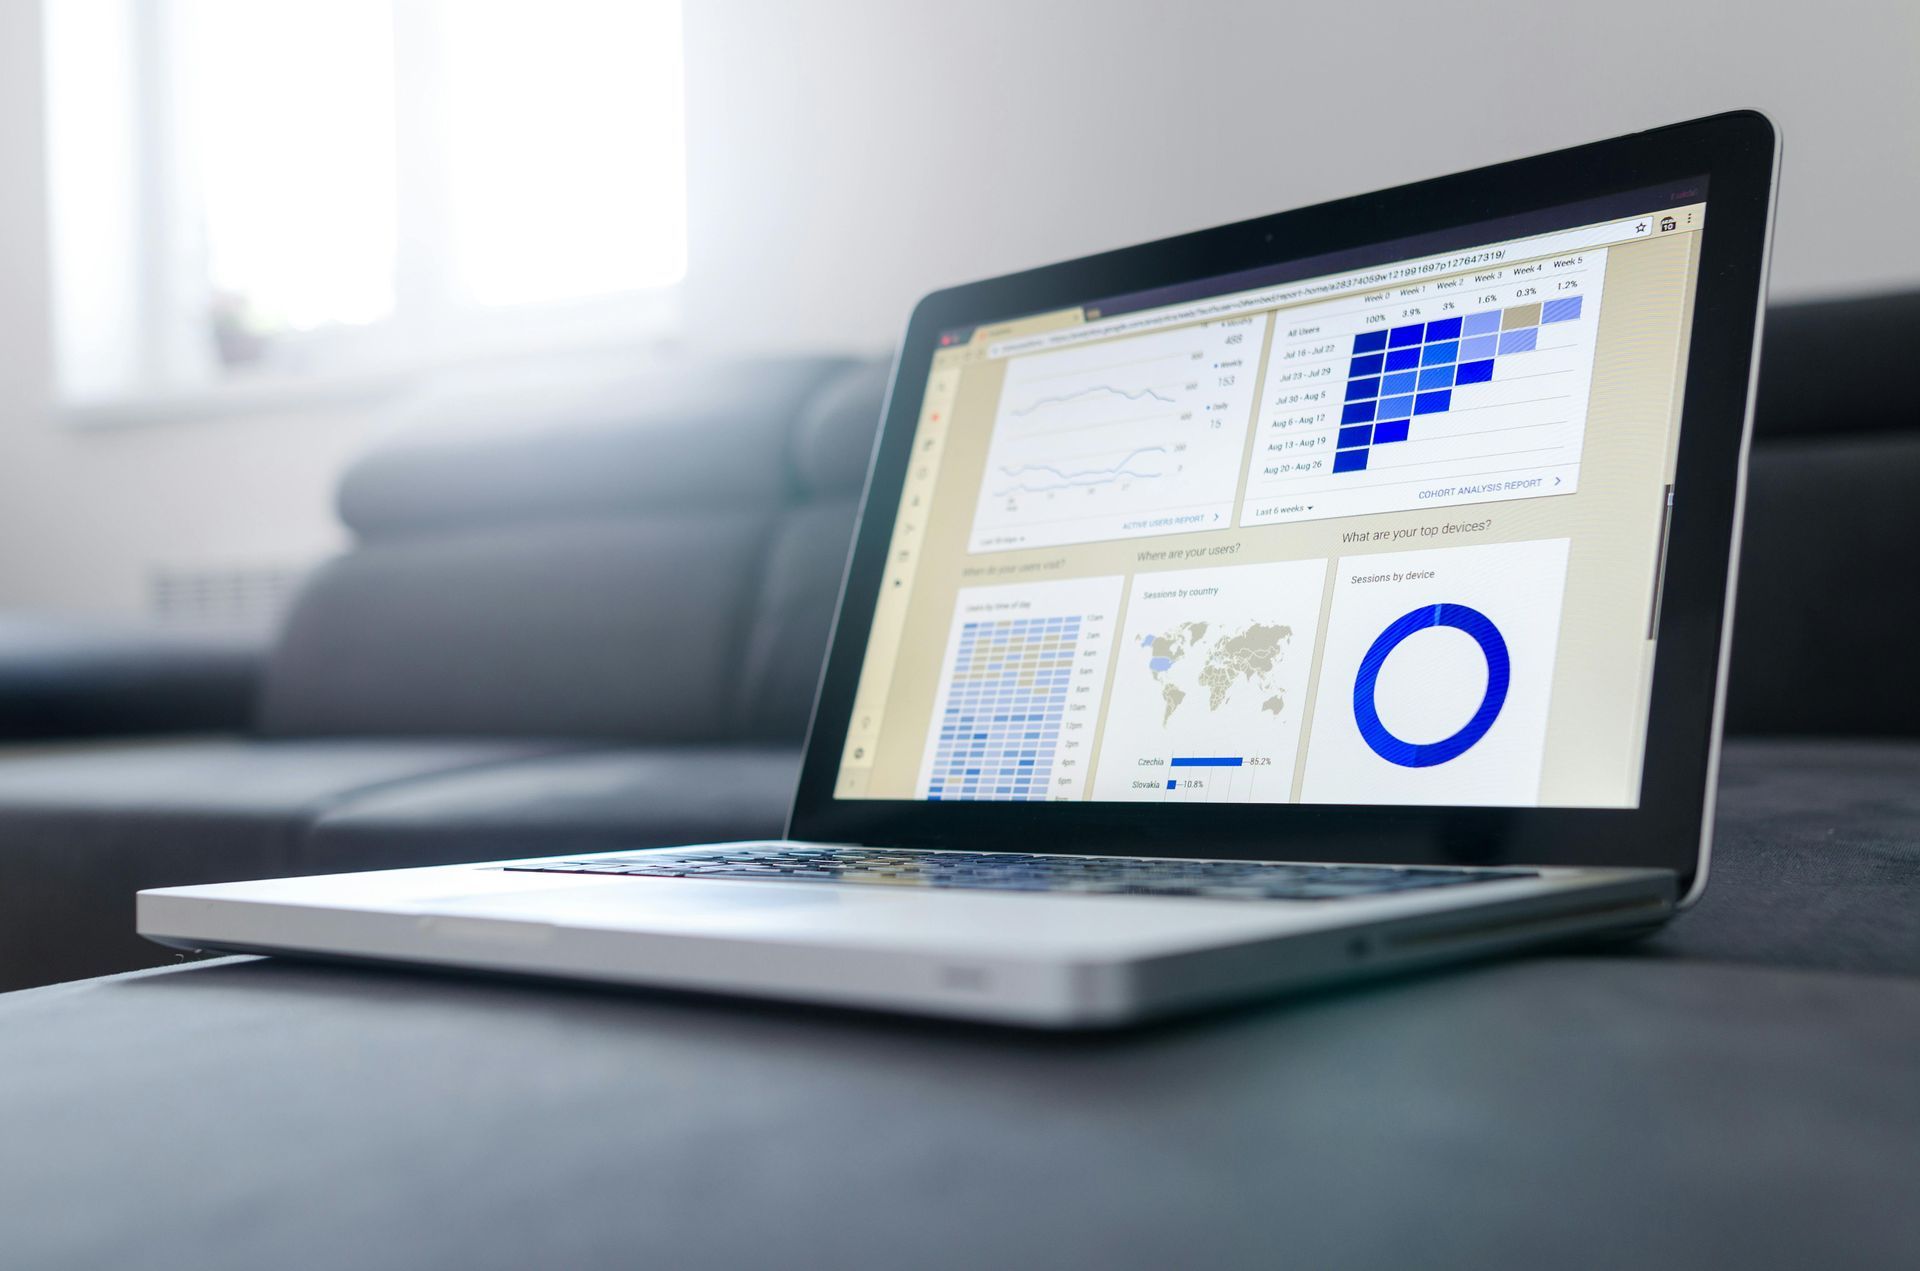
A BI dashboard is a dynamic data visualization and analysis tool that displays your organization’s most important metrics and key performance indicators (KPIs) on a single, interactive screen. It automatically collects live data from all your business systems—sales, marketing, finance, operations—and presents it as easy-to-understand charts, graphs, and tables. This means you can instantly see what’s working, what’s not, and where to focus your efforts for maximum impact..
why Bi Dashboards.
Why Modern Businesses Need BI Dashboards.
Real-Time, Data-Driven Decisions
BI dashboards deliver up-to-the-minute insights, allowing you to spot trends, uncover opportunities, and respond to challenges before they escalate. Instead of relying on outdated reports or gut feeling, your team gets fact-based clarity to act with confidence.
Enhanced Data Visualization
Complex data is transformed into intuitive visuals—making it easy for everyone, from executives to frontline staff, to interpret results and take action. Interactive elements like filters and drill-downs let users explore the data most relevant to their roles.
Increased Efficiency and Productivity
Automate data collection and reporting, freeing your team from manual spreadsheet work. With dashboards updating in real time, employees can focus on strategic tasks and innovation, not data wrangling.
Predictive and Prescriptive Analytics
Go beyond what happened—anticipate what’s next. Our BI dashboards integrate predictive analytics, helping you forecast trends, identify risks, and seize opportunities before your competitors do.
What to Track
What Can You Track with a BI Dashboard?
Our dashboards are purpose-built for your unique needs. Examples include:
1.
Sales Performance
Revenue by region, quota attainment, pipeline value, win/loss ratios, customer lifetime value.
2.
Marketing Effectiveness
Campaign ROI, lead conversion rates, website traffic, cost per acquisition, customer engagement.
4.
Operations
Inventory turnover, supply chain efficiency, equipment maintenance alerts, project timelines.
Every dashboard is fully interactive, enabling you to filter by time period, region, product, or any other dimension that matters to your business.
Industry-Specific Examples
- E-commerce: Track sales by product, monitor cart abandonment, analyze customer segments, and optimize inventory in real time.
- Nonprofits: Evaluate program impact, fundraising performance, and volunteer engagement with transparent, actionable metrics.
- Manufacturing: Monitor equipment health, production efficiency, and supply chain risks to reduce downtime and costs.
How Our BI Dashboard Solutions Work
- Discovery & Consultation: We assess your data sources, business goals, and reporting needs.
- Custom Design & Integration: Our experts build dashboards tailored to your KPIs, integrating all relevant data streams.
- Implementation & Training: We deploy your dashboards and train your team for maximum adoption and impact.
- Ongoing Optimization: Continuous support and refinement as your business evolves.
Why Choose Empower Digital Data?
Ready to See Your Business in a Whole New Light?
Book a Personalized BI Dashboard Demo Today. Experience firsthand how Empower Digital Data can turn your data into your most powerful business asset. Let’s unlock your growth potential—request your custom demo now!


